imzMLConverter (Version 1)
Alan M. Race, Iain B. Styles and Josephine Bunch
Download imzMLConverter version 1.3.0 and sample data
If you use imzMLConverter in published research, please include a citation to the following article:
- Inclusive sharing of mass spectrometry imaging data requires a converter for all. Alan M. Race, Iain B. Styles, Josephine Bunch, Journal of Proteomics, 75(16):5111-5112, 2012. http://dx.doi.org/10.1016/j.jprot.2012.05.035
If you would like to have the source code, or have any problems with imzMLConverter or wish to request a new feature then please email alan.race@uni-bayreuth.de.
- About imzMLConverter
- How To Use imzMLConverter
- Using imzMLConverter to parse imzML in MATLAB
- Using imzMLConverter to parse imzML in R
About imzMLConverter
imzMLConverter allows conversion to the imzML mass spectrometry imaging standard utilising the mzML mass spectrometry standard as an intermediary format. mzML was selected as an intermediary format as work has already been completed for conversion from vendor proprietary formats and made available online in converters such as msconvert. imzMLConverter also enables combining multiple imzML files into a single imzML file for comparison and data processing.
imzMLConverter was written in Java and can be used as an API for processing imzML (and mzML) data.
Freely available imzML viewing software include Datacube Explorer (available here) and BioMAP (available from imzML.org).
WARNING: BioMAP only supports imzML in the ‘continuous’ form (see the data structure section on the imzML website for details). This means if your data is stored in mzML as m/z, intensity pairs then BioMAP will load the data incorrectly (this is true for the example data supplied here). If your mzML data is binned already and every spectrum has the same m/z list then BioMAP will load the data correctly.
Version history and change list
- 1.3
- Feature: Added the ability to use Waters .pat files as the ‘Spectra Location File’ for converting Waters Synapt images.
- 1.2
- Bug fix: SHA-1 hashes are now generated correctly in all cases.
- Feature: Can now parse mzML and mzML headers, allowing imzMLConverter to be used to load both mzML and imzML into MATLAB, R and Java.
- Feature: Can now output valid mzML files.
- 1.1.1
- Bug fix: Incorrect defaultSourceFileRef being selected when converting from RAW files.
- 1.1.0
- Feature: Added copy constructors to all (i)mzML classes to aide saving altered imzML files.
- 1.0.8
- Bug fix: Spectra from imzML files using IMS:1000141 instead of MS:1000519 were returned as empty.
- 1.0.7
- Bug fix: In certain situations when combining imzML files of different sizes, the height was calculated incorrectly. 1.0.6
- Feature: Added the ability to remove empty spectra during the conversion for compatibility with BioMAP. 1.0.5
- Feature: Added the ability to get the name of the analyser used to acquire a given spectrum.
- 1.0.4 Interface: GUI should now look the same on both Linux and Windows. Previously sizes and positions were slightly different.
- 1.0.3
- Bug fix: ‘pixel size’ is now included in the imzML file when filled in on the ‘Scan’ tab. imzML validity: Can now select the area unit (e.g. m2, cm2, mm2) for ‘pixel size’ where previously it was set to the parent ‘area unit’.
- 1.0.2 - imzML Workshop in Rauischholzhausen (23/09/12 - 27/09/12)
Change: Removed
that did not have to reduce the size of the imzML file and for compatibility with DatacubeExplorer. - Bug fix:
was skipped when parsing. - Bug fix: The UUID was omitted from the imzML file but was included in the ibd file.
- Bug fix If multiple mzML files were combined which each contained
then only the s from the first mzML file were included in the imzML file. - imzML validity: Included SHA-1 hash of the ibd file in the imzML file.
- Bug fix:
- 1.0.1
- Bug fix: getmzArray() and getIntensityArray() would always read in double precision values, ignoring the data type set in imzML.
- Bug fix: When using ‘Image per file’ setting scan pattern was always set to ‘meandering’.
- Bug fix: When using ‘Row per file’ setting scan pattern was always set to ‘flyback’.
- Bug fix: ‘Scan direction’ and ‘Line scan direction’ settings were previously ignored.
- imzML validity: imzMLConverter was omitted from
. - imzML validity: Conversion to imzML was omitted from
. There isn’t a specific CV for conversion to imzML so using ‘MS:1000530’.
- 1.0.0
- Original release
How To Use imzMLConverter
To run imzMLConverter double-click on the ‘run.bat’ or ‘run.sh’ file supplied with imzMLConverter, or alternatively to run from the command line (changing ‘C:\imzMLConverter’ to the location you downloaded imzMLConverter to), use the following command:
java -jar -Xmx1024m C:\imzMLConverter\imzMLConverter.jar
Converting mzML to imzML
To convert mzML to imzML the mzML files must first be added to the ‘Files that make up the image’ list. This is done by clicking the ‘Add’ button, shown in Figure 1. Graphical user interface for imzMLConverteronverter. To add mzML files simply click the ‘Add’ button.
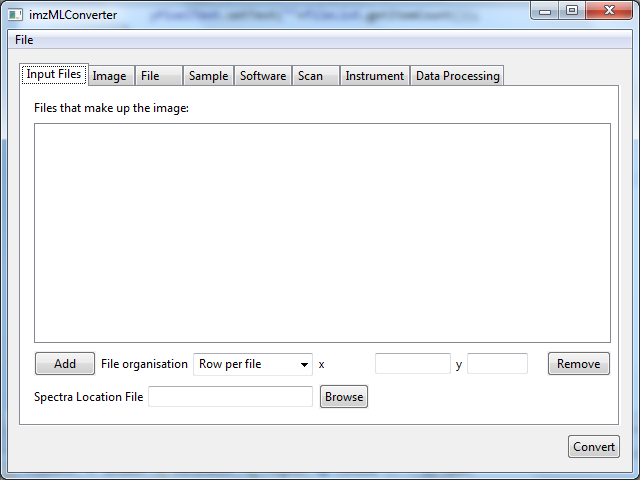 Figure 1. Graphical user interface for imzMLConverter. To add mzML files to convert, click the ‘Add’ button, which will bring up a open file dialog (shown in Figure 2).
The type of imaging run determines the contents of the mzML files. If a raster mode imaging run was conducted then typically a single mzML file will contain the spectra from a single raster line. If this is the case then ‘Row per file’ should be selected on the ‘File organisation’ drop down box. However, spot mode imaging results in a single mzML file for the entire imaging run. In this instance ‘Image per file’ should be selected on the ‘File organisation’ drop down box. The other option for ‘File organisation’ is ‘Spectrum per file’. This option allows non-imaging mass spectrometry data (which will typically have a single mzML file containing only a single spectrum) to be converted to the imzML format. This enables visualisation of non-imaging mass spectrometry data in a ‘pseudoimage’ as well as reducing data size and enabling data analysis to be performed by any software that supports the imzML format.
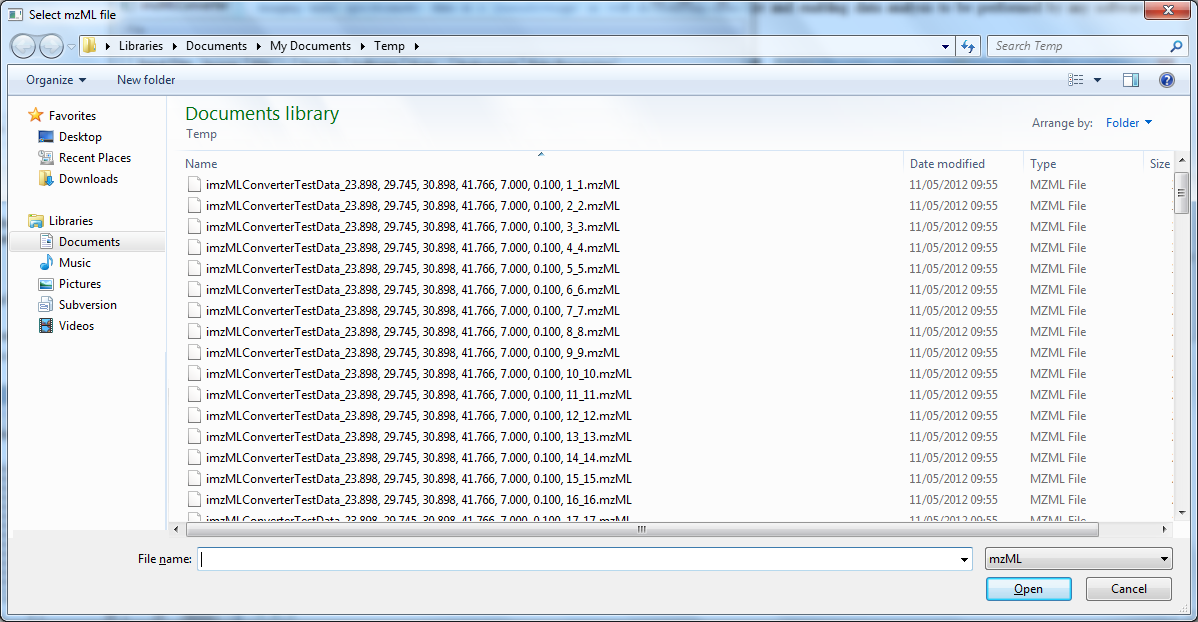 Figure 2. Select mzML files in the order that they should appear in the image.
Once all of the mzML files that make up the image have been added to the list and the file organisation has been selected, the interface should look similar to Figure 3. imzMLConverter uses the instrument parameters specified in the first mzML file in the list as a template for the parameters to store in the imzML file to limit the amount of information the user must input. At this point it is possible to alter any of this header information if it is either incorrect of insufficiently detailed by selecting the relevant tab(s) and adding or removing values from the controlled vocabulary. This should contain all of the experimental, instrumental, contact and sample details about the imaging experiment.
It is possible to use imzMLConverter to change the data type used to store both the m/z arrays and the intensity arrays. Altering this can be done on the ‘Image’ tab. Changing the data type can be used to reduce (or increase) the size of the binary portion of the image, at the cost of decreased precision.
Compression can also be selected on the ‘Image’ tab to reduce the data size, however please ensure that the software you are planning to use accepts imzML files that have been compressed.
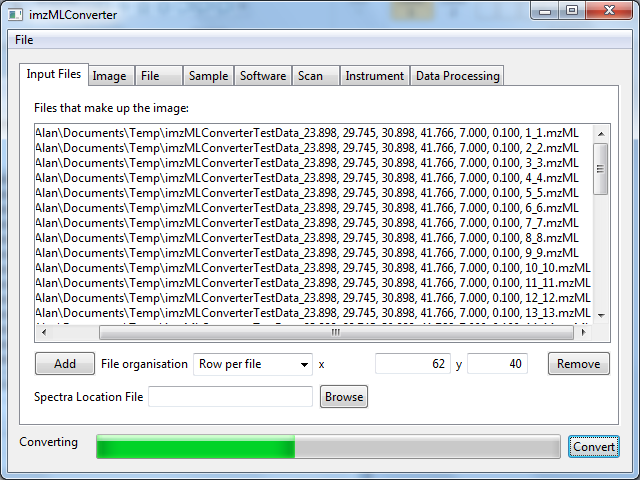 Figure 3. All mzML files that make up the image have been added to the list and the file organisation has been selected. At this point the user can alter any of the instrumental and experimental details if they are incorrect or insufficiently detailed. When happy with all alterations and the number of pixels in the x and y dimensions that make up the image have been entered, the ‘Convert’ button will begin the conversion. The progress bar indicates how much of the conversion has completed. Converting the data may take some time.
Before converting it is best to ensure that the x and y text boxes contain the correct number of pixels for the width and the height of the image. The x text box is automatically filled based on the number of spectra in the first mzML file and the y text box is automatically filled with the number of mzML files in the list. This is only correct for the ‘Row per file’ organisation (raster imaging).
If the image is not stored as rectangle where every pixel has a spectrum (for example, polygonal and 3D image areas) then it is possible to supply a text file containing the x, y, z coordinates of the spectra in the order they appear in the mzML files within the list. The example below shows a 3x2x1 image where the first 6 spectra in the mzML file(s) make up the image. If the image is only 2D it is possible to omit the z dimension from the text file. If a spectrum should be skipped and not included in the image then set x and/or y to -1, this will cause imzMLConverter to ignore the spectrum completely.
1 1 1
2 1 1
3 1 1
1 2 1
2 2 1
3 2 1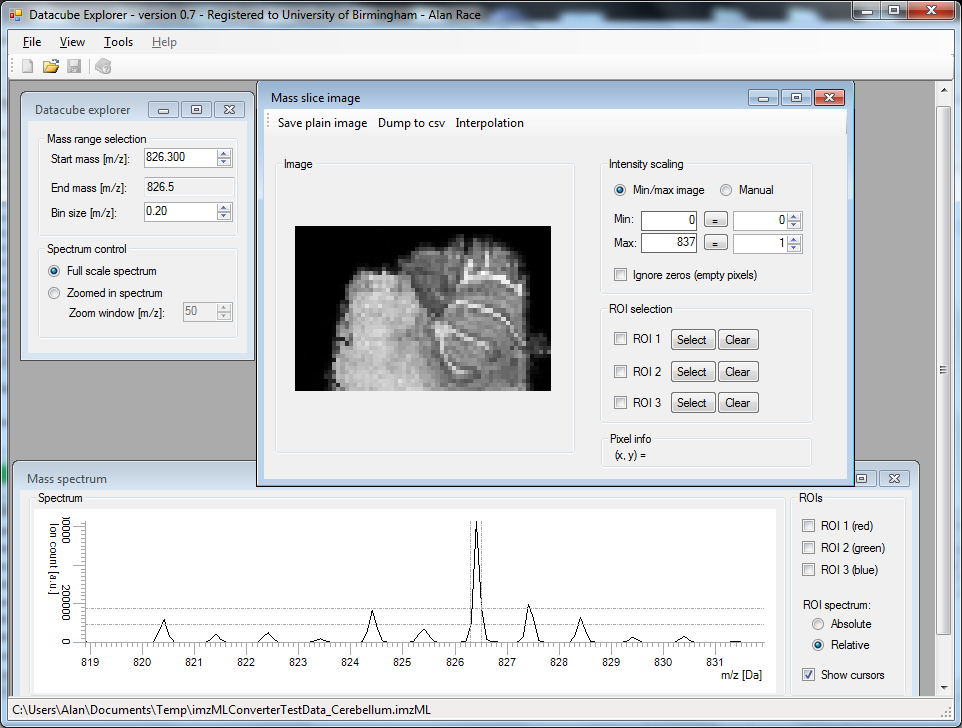 Figure 4. The converted sample data opened in Datacube Explorer (FOM Institute AMOLF), showing m/z 826.
The ‘Convert’ button begins the conversion. A progress bar will indicate how much of the conversion has been completed, but the interface may become unresponsive during this time. This does not mean that it has crashed, simply that it is parsing a mzML file.
Converting Waters data
To convert Waters data, first convert the .raw file to mzML, then add the mzML file to imzMLConverter as described above. Then click on the ‘Browse’ button to select a ‘Spectra Location File’. Change the file type to ‘Waters pattern file’, select the .pat pattern file used to acquire the image and then click ‘Convert’.
Combining multiple imzML files
To add imzML files to the ‘Files that make up the image’ list, click the ‘Add’ button and change the file type drop down list to imzML. Then select all of the imzML files that should be combined together. Instrumentation and experimentation parameters can be changed in the same way as when converting mzML files, however they will initially be based on the first imzML file in the list. The ‘File organisation’ drop down list can be ignored when combining imzML files, however the x and y text boxes now determine the number of imzML files that should be placed in the x and y dimensions respectively. If the images are of different sizes then any spare space will be filled with empty spectra. To combine the selected imzML files click the ‘Convert’ button and enter a file name for the output.
Using imzMLConverter to parse imzML in MATLAB
To use imzMLConverter in MATLAB you must first add the JAR file to the Java class path (changing ‘C:\imzMLConverter’ to the location you downloaded imzMLConverter to). This only needs to be done once per MATLAB session.
javaclasspath('C:\imzMLConverter\imzMLConverter.jar');Then to parse an imzML file, simply pass the name and path of the imzML file to the parseimzML function of the ImzMLHandler class. This returns an instance of the ImzML class which has functions such as getWidth() and getHeight() to get information about the image.
filename = 'C:\imzMLConverter\TestData\myImage.imzML';
imzML = imzMLConverter.ImzMLHandler.parseimzML(filename);

nColumns = imzML.getWidth();
nRows = imzML.getHeight();
To load and plot a spectrum, simply use the getSpectrum(x, y) function which is part of the ImzML class, which returns an instance of the Spectrum class. This has the methods getmzArray() and getIntensityArray() for retrieving the m/z and intensities of the spectrum in double format.
x = 1;
y = 1;

mzs = imzML.getSpectrum(x, y).getmzArray();
counts = imzML.getSpectrum(x, y).getIntensityArray();

figure, plot(mzs, counts);
Using imzMLConverter to parse imzML in R
To use imzMLConverter in R you must first ensure that the rJava package is installed by executing the following command:
install.packages("rJava")Then the Java virtual machine must be initialised and the imzMLConverter JAR file must be added to the Java class path (changing ‘C:\imzMLConverter’ to the location you downloaded imzMLConverter to). This only needs to be done once per R session.
library(rJava)
.jinit()
.jaddClassPath(path="C:\imzMLConverter\imzMLConverter.jar")
Then to parse an imzML file, simply pass the name and path of the imzML file to the parseimzML function of the ImzMLHandler class. This returns an instance of the ImzML class which has functions such as getWidth() and getHeight() to get information about the image.
filename <- "C:\imzMLConverter\TestData\myImage.imzML";
imzML <- J("imzMLConverter.ImzMLHandler")$parseimzML(filename)

width <- J(imzML, 'getWidth')
height <- J(imzML, 'getHeight')
To load and plot a spectrum, simply use the getSpectrum(x, y) function which is part of the ImzML class, which returns an instance of the Spectrum class. This has the methods getmzArray() and getIntensityArray() for retrieving the m/z and intensities of the spectrum in double format.
x <- 1;
y <- 1;

spectrum <- J(imzML, 'getSpectrum', as.integer(x), as.integer(y))

mzs <- J(spectrum, 'getmzArray')
counts <- J(spectrum, 'getIntensityArray')

plot(mzs, counts, "l")